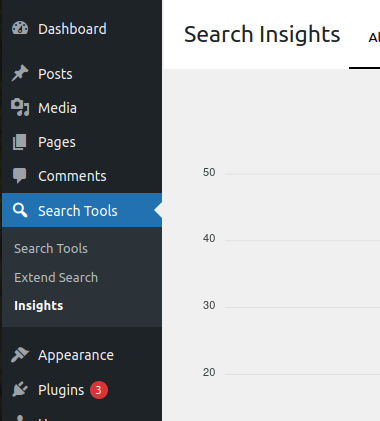
Statistics what people search for are presented in the Search Tools – Insights admin page.
Right after the installation the graph and the statistics tables are blank, while data must be collected firstly.
You can test it by yourself or wait for users real world data.
What data are stored?
When there is a search action taking place on the website, plugin stores following:
- search term
- search results
- user role (or “guest” for not logged in)
No personal data is saved, neither IP address nor anything else. Only if the user is logged in or not. The plugin is perfectly GDPR compliant.
User Roles Data
Search Insights can be viewed for:
- All Users
- only logged in users
- only guests (not logged in users)
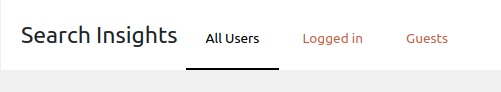
You can toggle between them at the top left.
The Graph
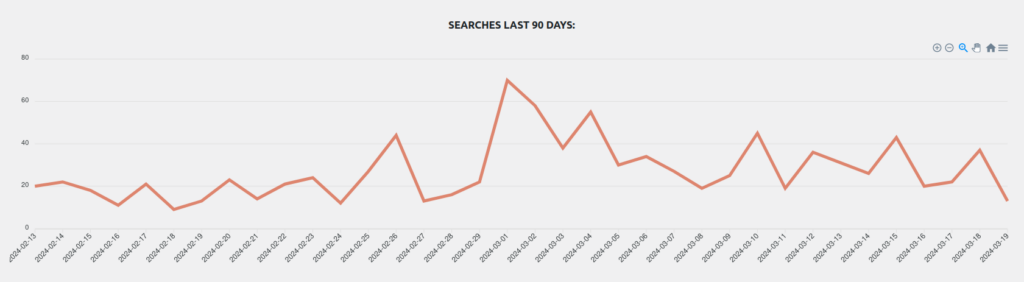
By default the graph shows searches made in the last 90 days. On hover the search count done that day is displayed. But you can do much more with the graph:
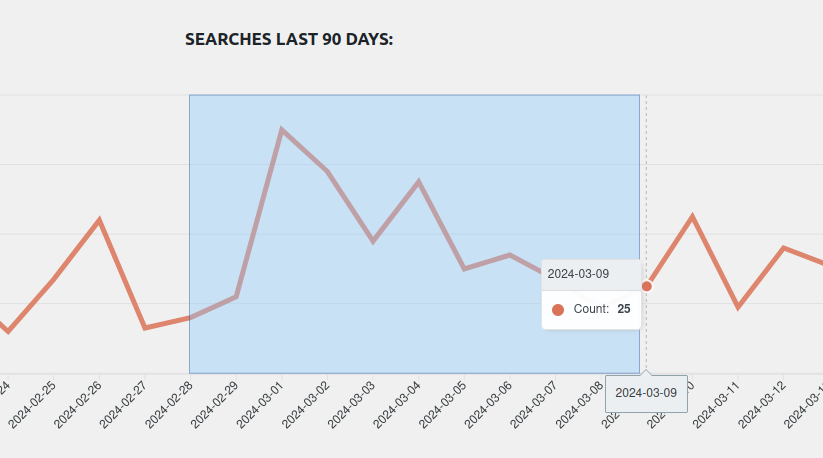
- show shorter time range
- export .png, .svg images of the graph
- export .csv file with structurized data
1. Show Shorter Time Range
Simply click on the graph and drag over the time period you are interested in:
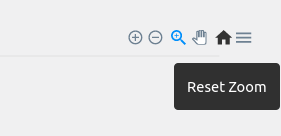
The zoom reset is via click on the “home” icon, top right:
2. and 3. Exports
Click on the graph hamburger menu icon (see above image preview) shows download options:
- Download SVG
- Download PNG
- Download CSV
Statistics Tables
Below the graph there is an overview of the search split according to the time period:
- Today
- Last 7 days
- Last 30 days
- This year
- Overall
Each table has a maximum limit 100 records.
Rows marked by the red text colour warn that the query doesn’t offer any search results.
Terms with the same “search count” are order alphabetically from A to Z.
The search is case insensitive. Terms “sola” and “SOLA” are considered as the same.
Learn more how to extend default WordPress search engine